

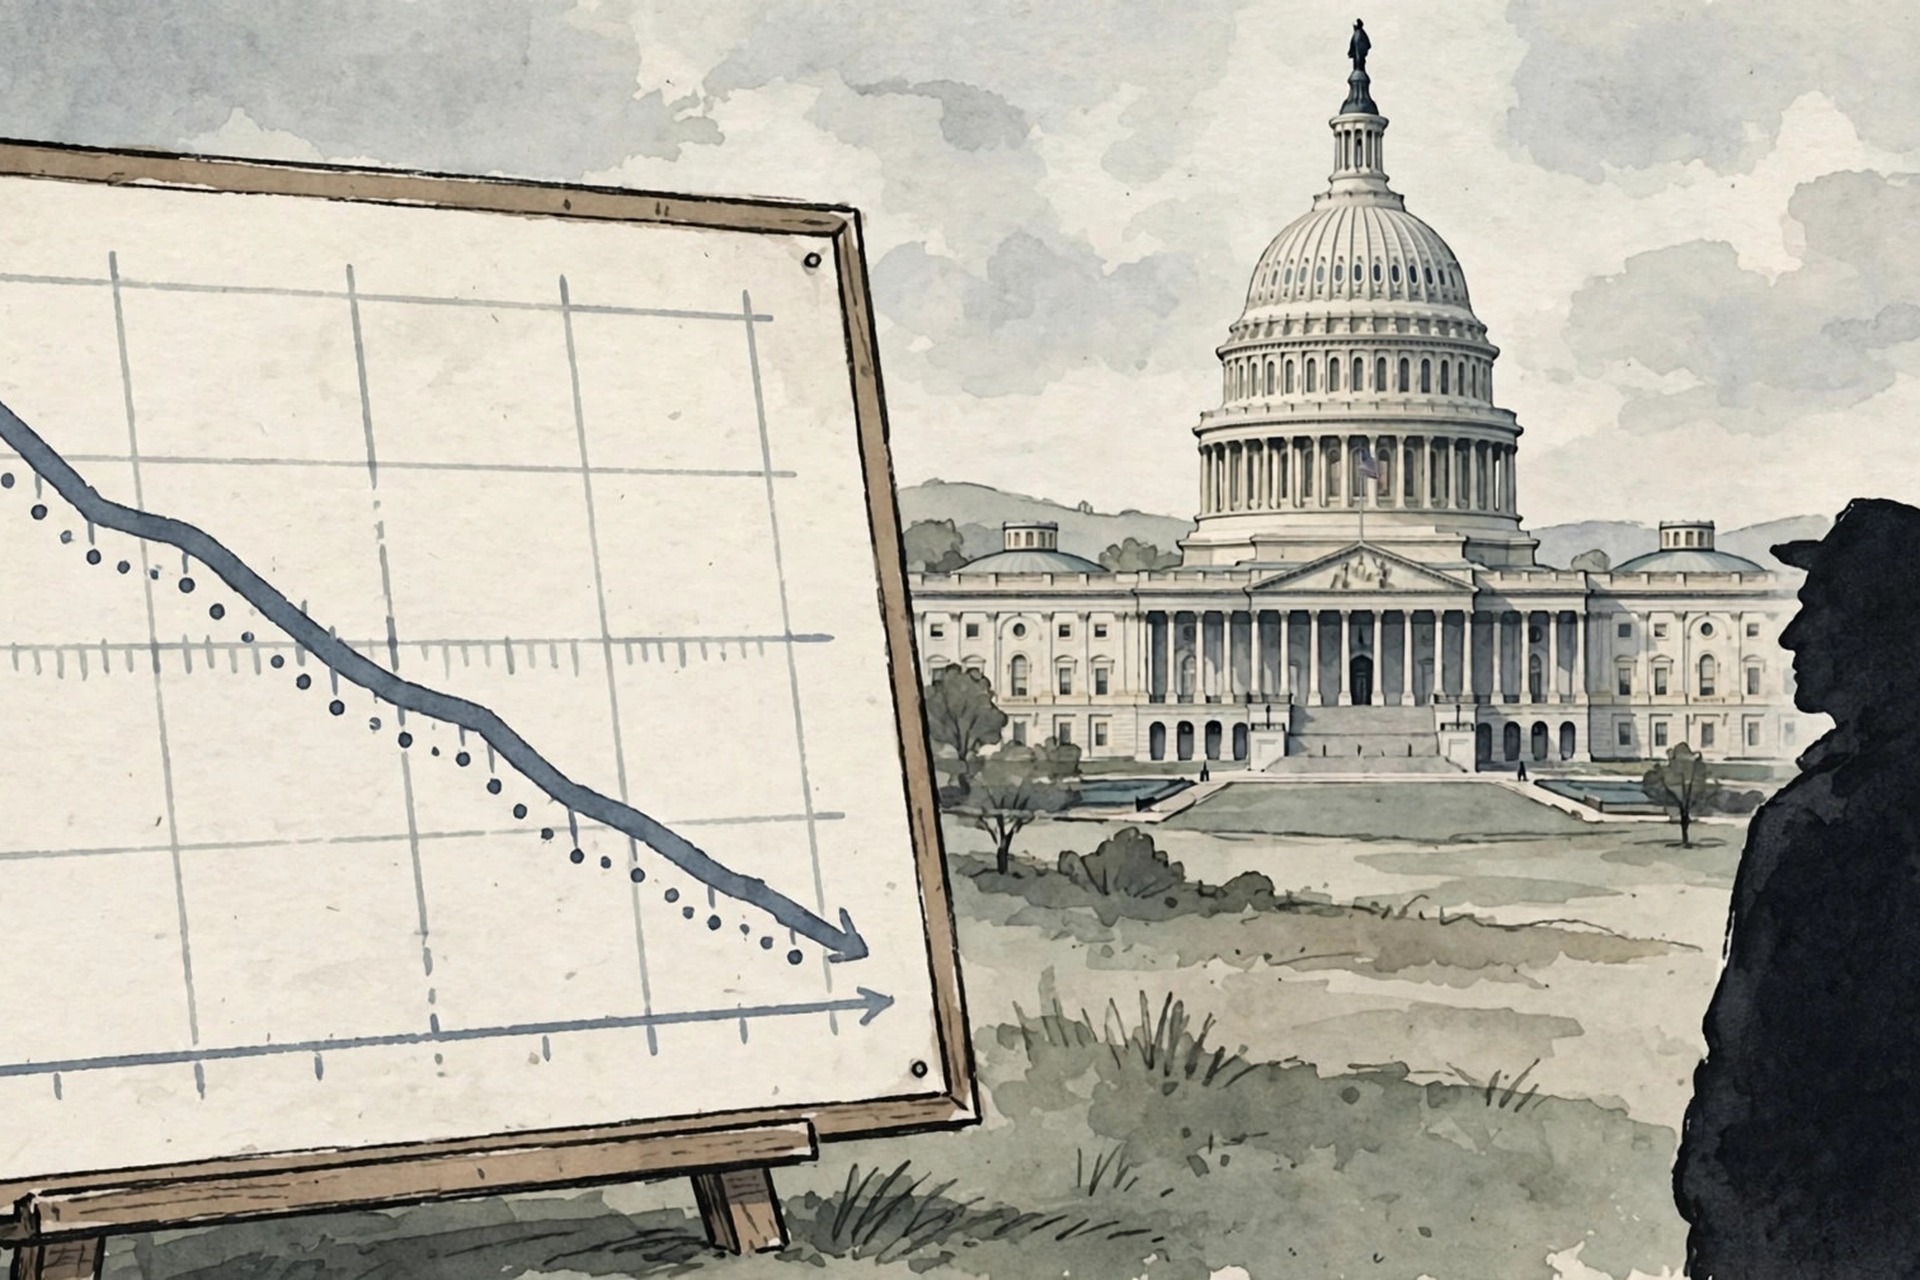
President Donald Trump enters the final days before the November 3 midterm election with an approval rating of 36 percent, the lowest for any president heading into a midterm election in the last 80 years, according to the New York Times poll tracker, which compiles the daily average of polls from various organisations, and in the Times’ final national poll with Siena University, conducted October 12 to 19, 2026, among 3,494 likely voters, 36 percent approved and 59 percent disapproved. The figure is not a single poll, but an average, and different pollsters produce different numbers, yet the direction across most measures is consistent: a president who began his second term with approval in the high 40s has fallen into the mid-30s, and the fall is closely tied, in the Times’ final national poll with Siena University, to how voters judge his handling of the cost of living. Just under three in 10 likely voters in that poll supported his management of Americans’ cost of living, and more than four in 10 Republicans disliked his handling of fuel costs.
That cost-of-living finding is the thread that runs through almost every other pre-election survey, even when the headline approval numbers differ. An AP-NORC survey of 1,119 adults, conducted October 8 to 12, found 85 percent named the economy among the most important issues in their vote and 84 percent named the cost of living, ahead of health care at 69 percent, the war involving Iran at 64 percent and artificial intelligence at 35 percent. The same survey put Trump’s approval at 36 percent, with 64 percent disapproving, although its field dates and methodology differ from the Times tracker, so the two 36 percent figures should not be treated as a single trendline. A Reuters/Ipsos poll conducted September 17 to 20 put approval at 32 percent, which Ipsos described as a low point across both of Trump’s presidencies, while a later Marist poll of likely voters in late October found 40 percent approving and 59 percent disapproving. NBC News polling, cited separately, put disapproval at 60 percent, a different survey with its own methodology, not the Times/Siena figure. The spread shows why averages matter more than any one survey, and why a single poll should never be quoted as if it were the electorate.
The historical comparison in the Times tracker deserves careful handling. Saying Trump has the lowest pre-midterm approval in 80 years is a statement about the tracker average at this point in the cycle, compared with previous presidents at the equivalent stage before their first midterm, not a claim that every pollster has recorded the same record, and not a prediction of the election result. A Wall Street Journal poll in September put approval at 37 percent, with 61 percent disapproving, and the Journal described that as the lowest it had recorded for any president heading into a midterm in polling going back to 1990. A Fox News survey released October 14 also found 36 percent approval, with 64 percent disapproving, and described that as the lowest approval Fox had recorded for Trump in either of his terms. Different baselines, same direction: by late October, the president’s standing was historically weak for a midterm year.
How Trump approval at 36 percent compares with past midterms
Historical midterm patterns give the approval figure its political weight, but they do not determine an outcome by themselves. Typically, when a president’s approval is below 50 percent, the president’s party loses seats in the House, and Gallup’s historical analysis has put the average loss at about 36 seats in such circumstances. That is an average across very different elections, maps and candidates, and the 2026 map has been redrawn mid-decade in several states, which complicates any simple comparison. Analysts also note that Trump’s approval is underwater even in some deep-red seats he won comfortably in 2024, according to the Cook Political Report’s House analyst, a sign that the drag is not confined to swing districts. At the same time, midterm elections are fought district by district, and candidate quality, local issues and turnout can blunt or amplify a national trend.
The intensity measures add another layer. A Focaldata-Financial Times poll released October 11 found just 13 percent of United States adults saying they strongly approved of Trump’s job performance, down from roughly 26 percent saying the same in a Quinnipiac University poll in May. Strong approval matters because it is a proxy for the enthusiasm of a president’s core supporters, the voters most likely to turn out, donate and volunteer. A University of Massachusetts Amherst poll released September 10 found a 9 percentage point drop since March among Republican voters who identify with the MAGA movement, a decline that, if sustained, would matter more for turnout than a shift among voters who already opposed the president. None of these figures, on their own, proves that Republican turnout will collapse; they suggest that the campaign’s closing argument faces a more sceptical audience than it did in the spring.
Consumer sentiment data point in the same direction as the political polls, though they measure something different. The University of Michigan’s consumer sentiment index stood at 48 in October, near the record low of 44.8 set in May, while the Conference Board’s consumer confidence index rose to 91.7 in October. The two indices use different methods and different questions, so their levels are not directly comparable, but the Michigan figure in particular captures household views on personal finances and broader economic conditions, and it has been weak for months. That weakness is consistent with the AP-NORC finding that cost-of-living concerns dominate voter priorities, and with the Reuters/Ipsos finding that 36 percent of voters thought Democrats were better poised to tackle the cost of living, compared with 28 percent who chose Republicans. On the issue voters say matters most, the president’s party is not, in that poll, the preferred handler.
Cost of living, fuel prices and the Iran war
The cost-of-living story in 2026 cannot be separated from fuel prices and the war involving Iran, which voters cite together as a combined pressure on household budgets. The annual inflation rate accelerated to 3.7 percent in September, up from 3.4 percent in preceding months, according to data cited in pre-election coverage, with energy prices a primary driver and energy costs jumping 5.2 percent between August and September alone. Trump campaigned on promises to halve energy costs in his first year, to end inflation, to make groceries cheaper and to avoid foreign wars, and critics argue that the war and the resulting fuel costs have undercut those promises. Supporters argue that global energy markets, not domestic policy alone, drive pump prices, and that the administration’s tax and tariff policies need more time to affect household costs. The polling suggests that, whatever the merits of those arguments, voters are not yet crediting the administration with delivering relief.
The Republican erosion on costs is particularly notable in the Reuters/Ipsos trend. In March, 25 percent approved of Trump’s handling of the cost of living; by September, 17 percent did. Republican approval of Trump fell from 82 to 73 percent in a single week in September in that pollster’s tracking, and for the first time this term, more Republicans disapproved of his cost-of-living record, at 51 percent, than approved, at 44 percent. Those are Reuters/Ipsos figures, not a consensus, and other pollsters show different levels, but the pattern of a cost-driven slide among the president’s own party is echoed in the Times/Siena finding that more than four in 10 Republicans disliked his handling of fuel costs. When a president loses ground on his strongest issue among his own supporters, the political problem is deeper than a generic midterm headwind.
Health care costs add a second household pressure that compounds the first. In a September poll of registered voters, KFF found 42 percent trusted Democrats to handle health care costs, compared with 22 percent who trusted Republicans. That gap matters because health care, at 69 percent in the AP-NORC survey, is the third-ranked issue for voters, behind only the economy and the cost of living, and because health insurance and prescription costs are felt monthly, like rent and groceries, rather than as abstract policy. The administration’s closing pitch has emphasised tax cuts, tariffs and affordability measures, but the polls suggest that voters are judging affordability by what they pay, not by what is promised, and that judgment is, for now, unfavourable.
What the polls do and do not predict
It is important to be explicit about what a 36 percent approval rating does not do. It does not predict the exact number of House or Senate seats that will change hands, because seat outcomes depend on district maps, candidate matchups and turnout in each state. It does not measure the generic ballot directly, although a Pew Research Center survey conducted September 28 to October 4 found 44 percent of registered voters backing the Democratic candidate in their district, against 36 percent for the Republican, a gap that is consistent with, but not identical to, the approval picture. And it does not capture the possibility, which pollsters and analysts routinely warn about, that likely-voter screens in the final days may miss late-deciding voters or underestimate turnout among one party’s base.
What the approval figure does capture is the national mood in which the midterm will be fought. A president at 36 percent, with disapproval at 59 percent in the Times/Siena poll, is a central figure in almost every competitive race, whether candidates want him to be or not. Democratic candidates can run against his record on costs and the war, while Republican candidates must decide whether to embrace him, distance themselves from him, or localise their races around issues where they are stronger. That strategic dilemma is visible in races from Kansas, where rising farming costs and opposition to the immigration crackdown have fed an unexpectedly close Senate race in a state that has not sent a Democrat to the Senate since 1932, to Ohio, where Republican Senator Jon Husted has said the war must end quickly so that petrol prices can fall. Those are local expressions of a national mood, not proof that every such race will break the same way.
For readers, the safest way to read the pre-midterm polls is as a snapshot with a margin of error, taken before votes are counted, not as a result. The Times tracker average, the Fox, Wall Street Journal, AP-NORC, Reuters/Ipsos and Marist figures all point in the same direction, but they differ by up to eight points, which is a reminder that polling is an estimate, not a census. The election on November 3 will provide the first hard test of whether that estimate was accurate, and whether cost-of-living anxiety, which dominates the surveys, translates into the seat losses that history would predict for a president at 36 percent. Until then, the approval rating is best understood as a measure of how voters feel about the president’s handling of their daily costs, and that feeling, across pollsters, is historically negative.
USN has previously reported on the midterm campaign, including Trump’s affordability closing pitch before the November 3 midterms (https://usnbreaking.com/trump-affordability-closing-pitch-before-november-3-midterms-tax-cuts-tariffs-and-prices-put-to-voters/), and the 2026 midterm outlook favouring Democrats for the House (https://usnbreaking.com/2026-midterm-elections-outlook-democrats-favoured-for-the-house-senate-race-tight/), which set out the seat-by-seat context for these national numbers.
Sources
USN reviewed reporting from multiple outlets for this story. Read more from USA Today: https://www.usatoday.com/story/news/politics/elections/2026/11/02/midterm-elections-news-updates-polls–live/92387083007/, EconoTimes: https://econotimes.com/Costs-and-Health-Care-Lead-Voter-Concerns-Before-U-S-Midterms-1768658 and The Columbus Dispatch: https://www.dispatch.com/story/news/politics/elections/2026/11/02/will-democrats-win-midterm-elections-how-much/92559918007/.